The Disappointing Performance of Model Portfolios
Be careful if you choose a commercially available model portfolio. Very few have outperformed an indexed benchmark over the long term.
Every advisor uses model portfolios; individually customizing portfolios would be grossly inefficient. But be careful if you choose a commercially available model. Very few have outperformed an indexed benchmark over the long term.
Model portfolios dominate the investment landscape. According to Morningstar, they held $424 billion in assets as of the end of 2023, with future growth expected. Models are the backbone of wirehouse and broker-dealer channels, where home offices offer models for advisor teams to adapt. They are the mainstay of turnkey asset management providers (TAMPs), including so-called “ETF strategists,” which employ research teams to select investment products and construct models. Models are also used throughout the RIA world, especially among roll-up firms, to standardize their investment offerings.
But have these model portfolios outperformed a simple, index-based benchmark?
To answer this question, Morningstar provided me with the full universe of 2,882 U.S.-domiciled models in its Morningstar Direct database. I compared the five- and 10-year performance of those models as of October 31, 2024, to the mutual fund VBIAX. This is a Vanguard mutual fund that maintains a 60/40 equity/fixed-income allocation. It has a 0.07% expense ratio (Admiral shares).
I analyzed only allocation models, which comprise approximately 77% of the models in Morningstar’s database. I eliminated models in these Morningstar categories:
US model conservative allocation
US model moderately conservative allocation
US model global allocation
Any model that had an equity allocation less than 60%, based on the model name (e.g., 50/50 models)
I had two reasons for eliminating the above. A conservative or moderately conservative model, or one with less than 60% equities, would not be expected to outperform a 60/40 allocation. Since I was using a U.S.-based benchmark, I eliminated global allocations.
There are two very important biases in the data. Morningstar’s data started with 3,581 models, but only 80.5% (2,882 models) remain. Most of the attrition has been in the last five years, as shown in the graph below:
This survivorship basis arises because providers discontinue their models if they produce inferior results. There is also selection bias. Data on models is reported voluntarily to Morningstar. Therefore, one can expect that models with poor performance results do not get reported to Morningstar. Studies of hedge-fund performance face the same issues of survivorship and selection bias.
The disappointing results
Here is a summary of the results:
The models consistently underperformed the benchmark, and the degree of underperformance worsened from five to 10 years. The degree of underperformance is understated because of the survivorship and selection biases.
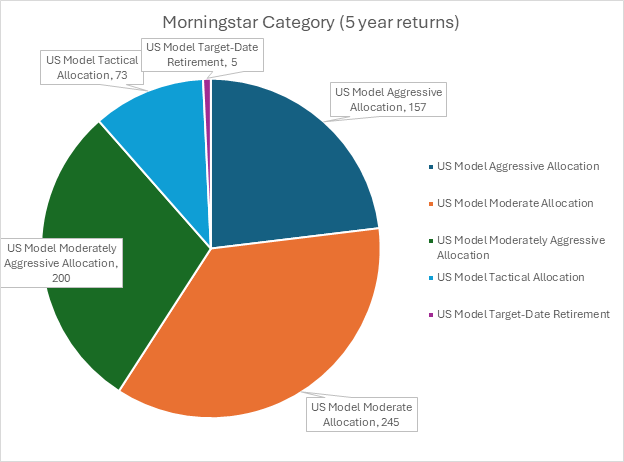
The appendix shows the distribution of the models based on Morningstar categories.
There are several reasons for this underperformance. Most importantly, these models engage in active management, since they deviate from a market-cap-weighted benchmark. The S&P SPIVA analysis, which measures the performance of actively managed mutual funds relative to an indexed benchmark, shows the same pattern of underperformance. Very few actively managed mutual funds or models can be expected to outperform an index fund over a long time horizon.
Many of these models are offered by large asset managers. Those firms employ a staff of economists, investment strategists and researchers. Those teams must demonstrate that they can add value, and that invariably means adding additional components to the asset allocation models. Those components might include commodities, alternatives, “smart beta” strategies, ESG/SRI, or other non-traditional asset classes or weightings. Some engage in market timing (“tactical allocations”). Each of those supposed ways of adding value increases the potential for underperforming the index, and that is exactly what has happened.
In some cases, these models are constructed to reduce volatility. If that is the case, these results show the price investors pay for that volatility reduction (79 or 136 basis points over five- or 10-year periods).
There was no persistence in the performance of the models. I took the models that had performed in the top quintile (top 20%) during the first five-year period (2014-2019). The graph below shows how they performed in the second five-year period (2019-2024):
Indeed, 74% of the top-performing models were discontinued or performed in the bottom two quintiles (bottom 40%) of the distribution during the second five years.
The key takeaways
There are very legitimate and justifiable reasons to outsource your investment management to a TAMP or other service provider. It may improve operational efficiency, allow you to spend more time on other aspects of your practice, or eliminate costs. But don’t outsource your investments with the hope of outperforming an indexed benchmark. Don’t believe the hype around models – especially claims that they are “institutional” or “sophisticated.” The odds are you will underperform over a reasonable time horizon.
Mostly, this reflects what advisors already know. It is incredibly hard to outperform a simple, low-cost, indexed solution.
Robert Huebscher was the founder of Advisor Perspectives and its CEO until the company was acquired by VettaFi in 2022. He was a vice chairman of VettaFi/TMX until April 2024.
Appendix – Distribution by Morningstar Category
Composition of models
Morningstar Direct provided data that shows the composition of its model database. For this analysis, I looked at the full universe of models (2,828 models).
The average number of holdings across all models is 17.8. But that number is influenced by the models that hold many individual equities, bonds or other securities. Here is the distribution of holdings across the model universe:
Additionally:
19 models (0.7%) have only one asset
91 models (3.2%) have three or fewer assets
270 models (9.6%) have five or fewer assets
1,121 models (39.6%) have 10 or fewer assets
The graph below shows the average number of positions in the models for those models that own at least one position. For example, of those models that own at least one equity (the first bar below), the average number of equities was approximately 56.
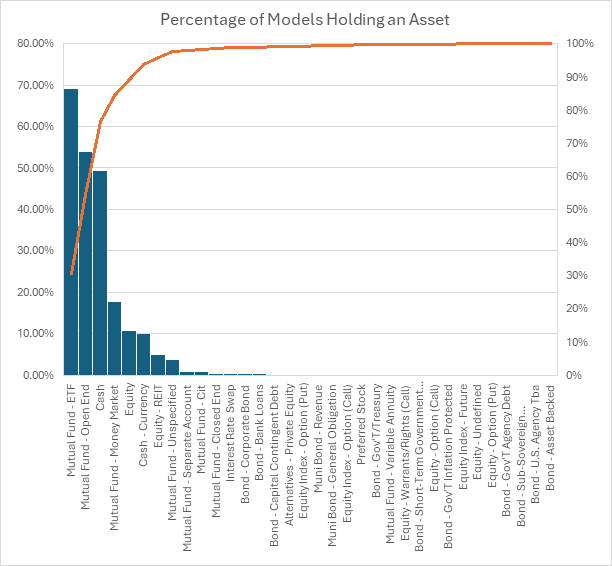
The graph below shows the percentage of models that hold at least one position in an asset. For example, approximately 69% of models have at least one mutual fund or ETF (the first bar below):


There is one model from Envestnet and none from Assetmark. Please email me, and I will send you the data file with my analysis. rhuebscher@mba1982.hbs.edu
Interesting study. Did the evaluation include Assetmark and Envestnet?