
Rethinking Defined‐Outcome ETFs: Performance, Fees and the Tradeoffs
Do Defined-Outcome ETFs offer better risk protection that a 60/40 allocation?

Defined‐outcome ETFs have been hailed as a breakthrough in risk management, offering investors a blend of downside protection and market exposure. An analysis of six years' data indicates that a low-cost, diversified allocation offers superior benefits.
One of the most-touted innovations in the ETF industry has been the introduction of “defined-outcome” (or “buffer”) ETFs. They now command approximately $30 billion of assets and have been promoted as a valuable tool for risk management.
Now, with six-plus years of data available, we can examine their historical record to see what benefits have accrued to investors.
The answer is not much.
Before reviewing the analysis, let’s examine how defined‐outcome ETFs work.
A defined-outcome ETF consists of a core holding (such as an S&P 500 index fund), against which call options are sold and put options are purchased. This limits the upside potential of the index fund but also provides downside protection. Defined-outcome ETFs have a term, typically one year, and investors know the extent of upside and downside protection, provided they purchase the ETF at the beginning of the term.
For example, a defined-outcome ETF might provide exposure to the S&P 500 subject to a 12% cap, with protection against the first 15% of losses, for a one-year period.
Defined-outcome ETFs provide exposure to the price appreciation of the index. They do not provide income from dividends (a fact which, regrettably, is not prominently featured in fund marketing materials). The average expense ratio for these ETFs is 0.78%; the dividend yield on the S&P 500 is approximately 1.27%. Investors are effectively paying more than 2% in fees, reflecting both the embedded cost of the option strategy and the missed dividend income relative to owning the index outright. They could own the index and execute the options transactions themselves to avoid those fees (although that would require some work to determine the correct sizing of the options positions).
The concept behind defined-outcome ETFs has been around for a long time and has been offered through structured notes and indexed annuities. ETFs have daily liquidity, transparency, and tax advantages over those structures. But that doesn't mean defined-outcome ETFs provide sufficient value to investors relative to their costs.
The track record of defined-outcome ETFs
I analyzed all defined-outcome ETFs that were linked to the S&P 500 using data from Morningstar Direct. I obtained six full years of data (starting in 2019) plus partial results for 2025.
The choice of a benchmark is crucial in this analysis. Morningstar uses an allocation that is 80% equities and 20% bonds. But I compared the performance of these ETFs to that of a 60/40 portfolio, using the Vanguard mutual fund VBIAX. This is more conservative and allowed me to compare performance after fees using a liquid, investable benchmark. Also, VBIAX reflects a market-cap weighted asset allocation, so it will “clear” and not face liquidity problems if assets flow into it.
VBIAX represents a conservative asset allocation designed to protect against equity losses, which is consistent with the goal of a defined-outcome ETF. If defined-outcome ETFs could outperform VBIAX over long horizons, they should be considered an acceptable risk management solution. But they don’t.
Below are the one-year returns for defined-outcome ETFs from 2019-2024, along with partial returns for 2025, compared to returns for VBIAX and the S&P 500 (using Vanguard’s VOO ETF):
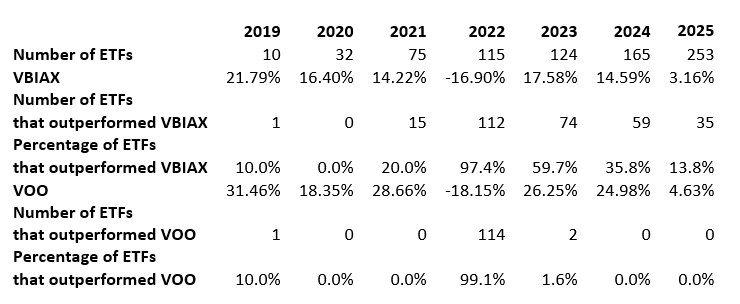
Source: Morningstar Direct. Data as of 2/20/25
Except for 2022, VBIAX handily outperformed most defined-outcome ETFs. Stocks and bonds performed poorly in 2022, and this was a banner year for the defined-outcome industry. It led to increased marketing to support defined-outcome ETFs and drove asset flows to the products. But investors cannot select a product, such as a defined-outcome ETF, based on the expectation of a bad year ahead; that is market timing. For defined-outcome ETFs to work as a risk-management tool, they must deliver acceptable results every year. (If one knew ahead of time that 2022 would turn out to be disastrous, they would have been in cash, not in a defined-outcome ETF.)
I included the results for VOO, even though it is not appropriate as a benchmark for defined-outcome ETFs. This was to illustrate that defined-outcome ETFs are not a substitute for a market-cap index fund for investors with long-term horizons. The performance sacrifice is too great. The next table illustrates this more clearly.
Below are the cumulative returns for VBIAX, VOO and defined-outcome ETF for the prior 6, 5, 4, 3 and 2 years:
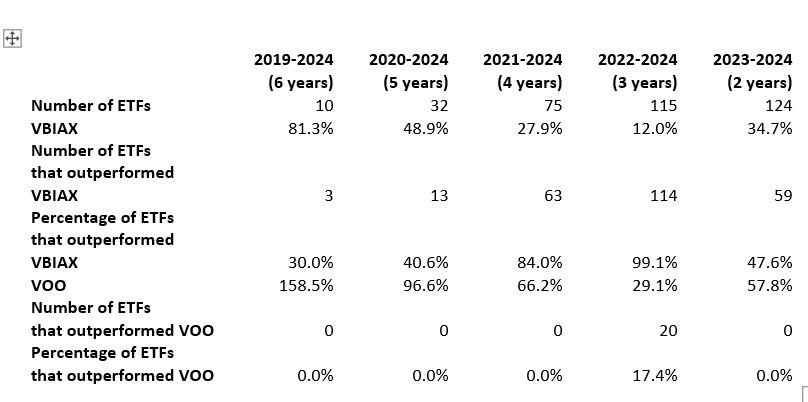
For the two longest time horizons, five and six years, VBIAX outperformed more than half of the defined-outcome ETFs. For three- and four-year horizons, the performance of defined-outcome ETFs in 2022 plays a greater role. But for the last two years, which exclude 2022, VBIAX was again superior.
The superiority of VOO over defined-outcome ETFs for investors with long time horizons is clear. VOO outperformed all defined-outcome ETF for the last four, five and six years.
Finally, let’s look at the volatility of defined-outcome ETFs compared to VBIAX and VOO, as measured by their standard deviations:
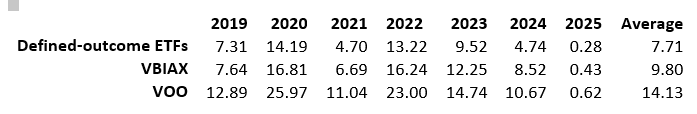
VBIAX was more volatile than the average of the defined-outcome ETFs. Financial theory suggests VBIAX outperforms defined-outcome ETFs by offering higher returns for higher risks. But for retirement-oriented investors with long horizons, the appropriate measure of risk is not standard deviation; it is the probability that they will not achieve their financial goals and not be able to sustain their desired standard of living in retirement. On this basis, VBIAX delivers better prospects for wealth accumulation.
Should you use defined-outcome ETFs?
The data strongly suggests that a 60/40 allocation with VBIAX is superior to defined-outcome ETFs. Over the longest time horizons available with historical data (five and six years), VBIAX has outperformed most defined-outcome ETFs, but with somewhat greater volatility.
This is to be expected, given the average expense ratios for defined-outcome ETFs, and the fact that their performance is based on price appreciation, exclusive of dividends. One must also consider that the return from defined-outcome ETFs is based on option pricing. Prices for options on equity indices, such as the S&P 500, are heavily dependent on the implied volatility of the index, and not on the price of the index itself. Retirement-oriented investors should not be placing “bets” on implied volatility in their investment strategy; they should be betting on the long-term appreciation of the capital markets.
VBIAX also has the advantage of liquidity; investors must hold a defined-outcome ETF for its full term to get the promised buffer and cap.
Defined‐outcome ETFs are attractive on paper, but the empirical evidence favors the time-tested approach of diversified, low-cost investing. For investors intent on building retirement wealth, the modest upside of these innovative products is outweighed by their high cost and limited benefits. As more data accumulates, the debate will continue, but for now, traditional allocations remain the safer bet.
Robert Huebscher was the founder of Advisor Perspectives and its CEO until the company was acquired by VettaFi in 2022. He was a vice chairman of VettaFi/TMX until April 2024.
Cory, One would need to do the analysis to be certain, but my expectation is that defined-outcome ETFs suffer from the same disadvantage (relative to a 60/40) on an after-tax basis as on a pre-tax basis. The fact that they carry roughly 200 basis points in effective expenses (their expense ratio plus the loss of dividends) is too big a hurdle to overcome.
Thanks, Jeffrey. I will request the data and post what I find out.